The numbers, live, without asking finance.
With Read & Navigate, open published reports in the browser. Change a filter to shift the view, drill from a figure to the journals and invoices behind it, export what you need — and never have to request or wait wait for a pack to be sent to you.
Browser based · No install · Nothing to train

Their reports. Straight answers. No wait.
Senior managers typically run the business off a handful of key reports. Similarly, Production managers also live in a set of key reports for their role too. Neither wants a reporting tool — they want the report they rely on, open now, showing where things actually stand. No request for data, no queue, no waiting for a refresh - just live data now.
Open a report, change a filter, drill on a number. That is the whole interface — no report building, no training course.
Run a report at any point in the month and see how the numbers are moving — early enough to do something about it.
Dimension security means managers see the individual slices of data they're supposed to see, from the same published report.
Every question answered in the reader is a question that didn't arrive in someone's inbox to be worked on.
Follow the money, four clicks deep.
Drill isn't a feature bolted onto the reader — it's how a question gets answered without anyone being asked.
Start on the report
Open a published P&L or cost-centre report and shift the filters — department, year, site, any dimension the author exposed.
Drill to the detail
Click the figure that looks wrong and see the transactions that make it up — the postings, not a summary of them.
Keep going sideways
From a journal to the invoice, and from the invoice to every invoice for that customer — using the drills the author defined.
Take it away
Export the view to Excel when you need to send it on or work on it — with the numbers already reconciled to the ledger.
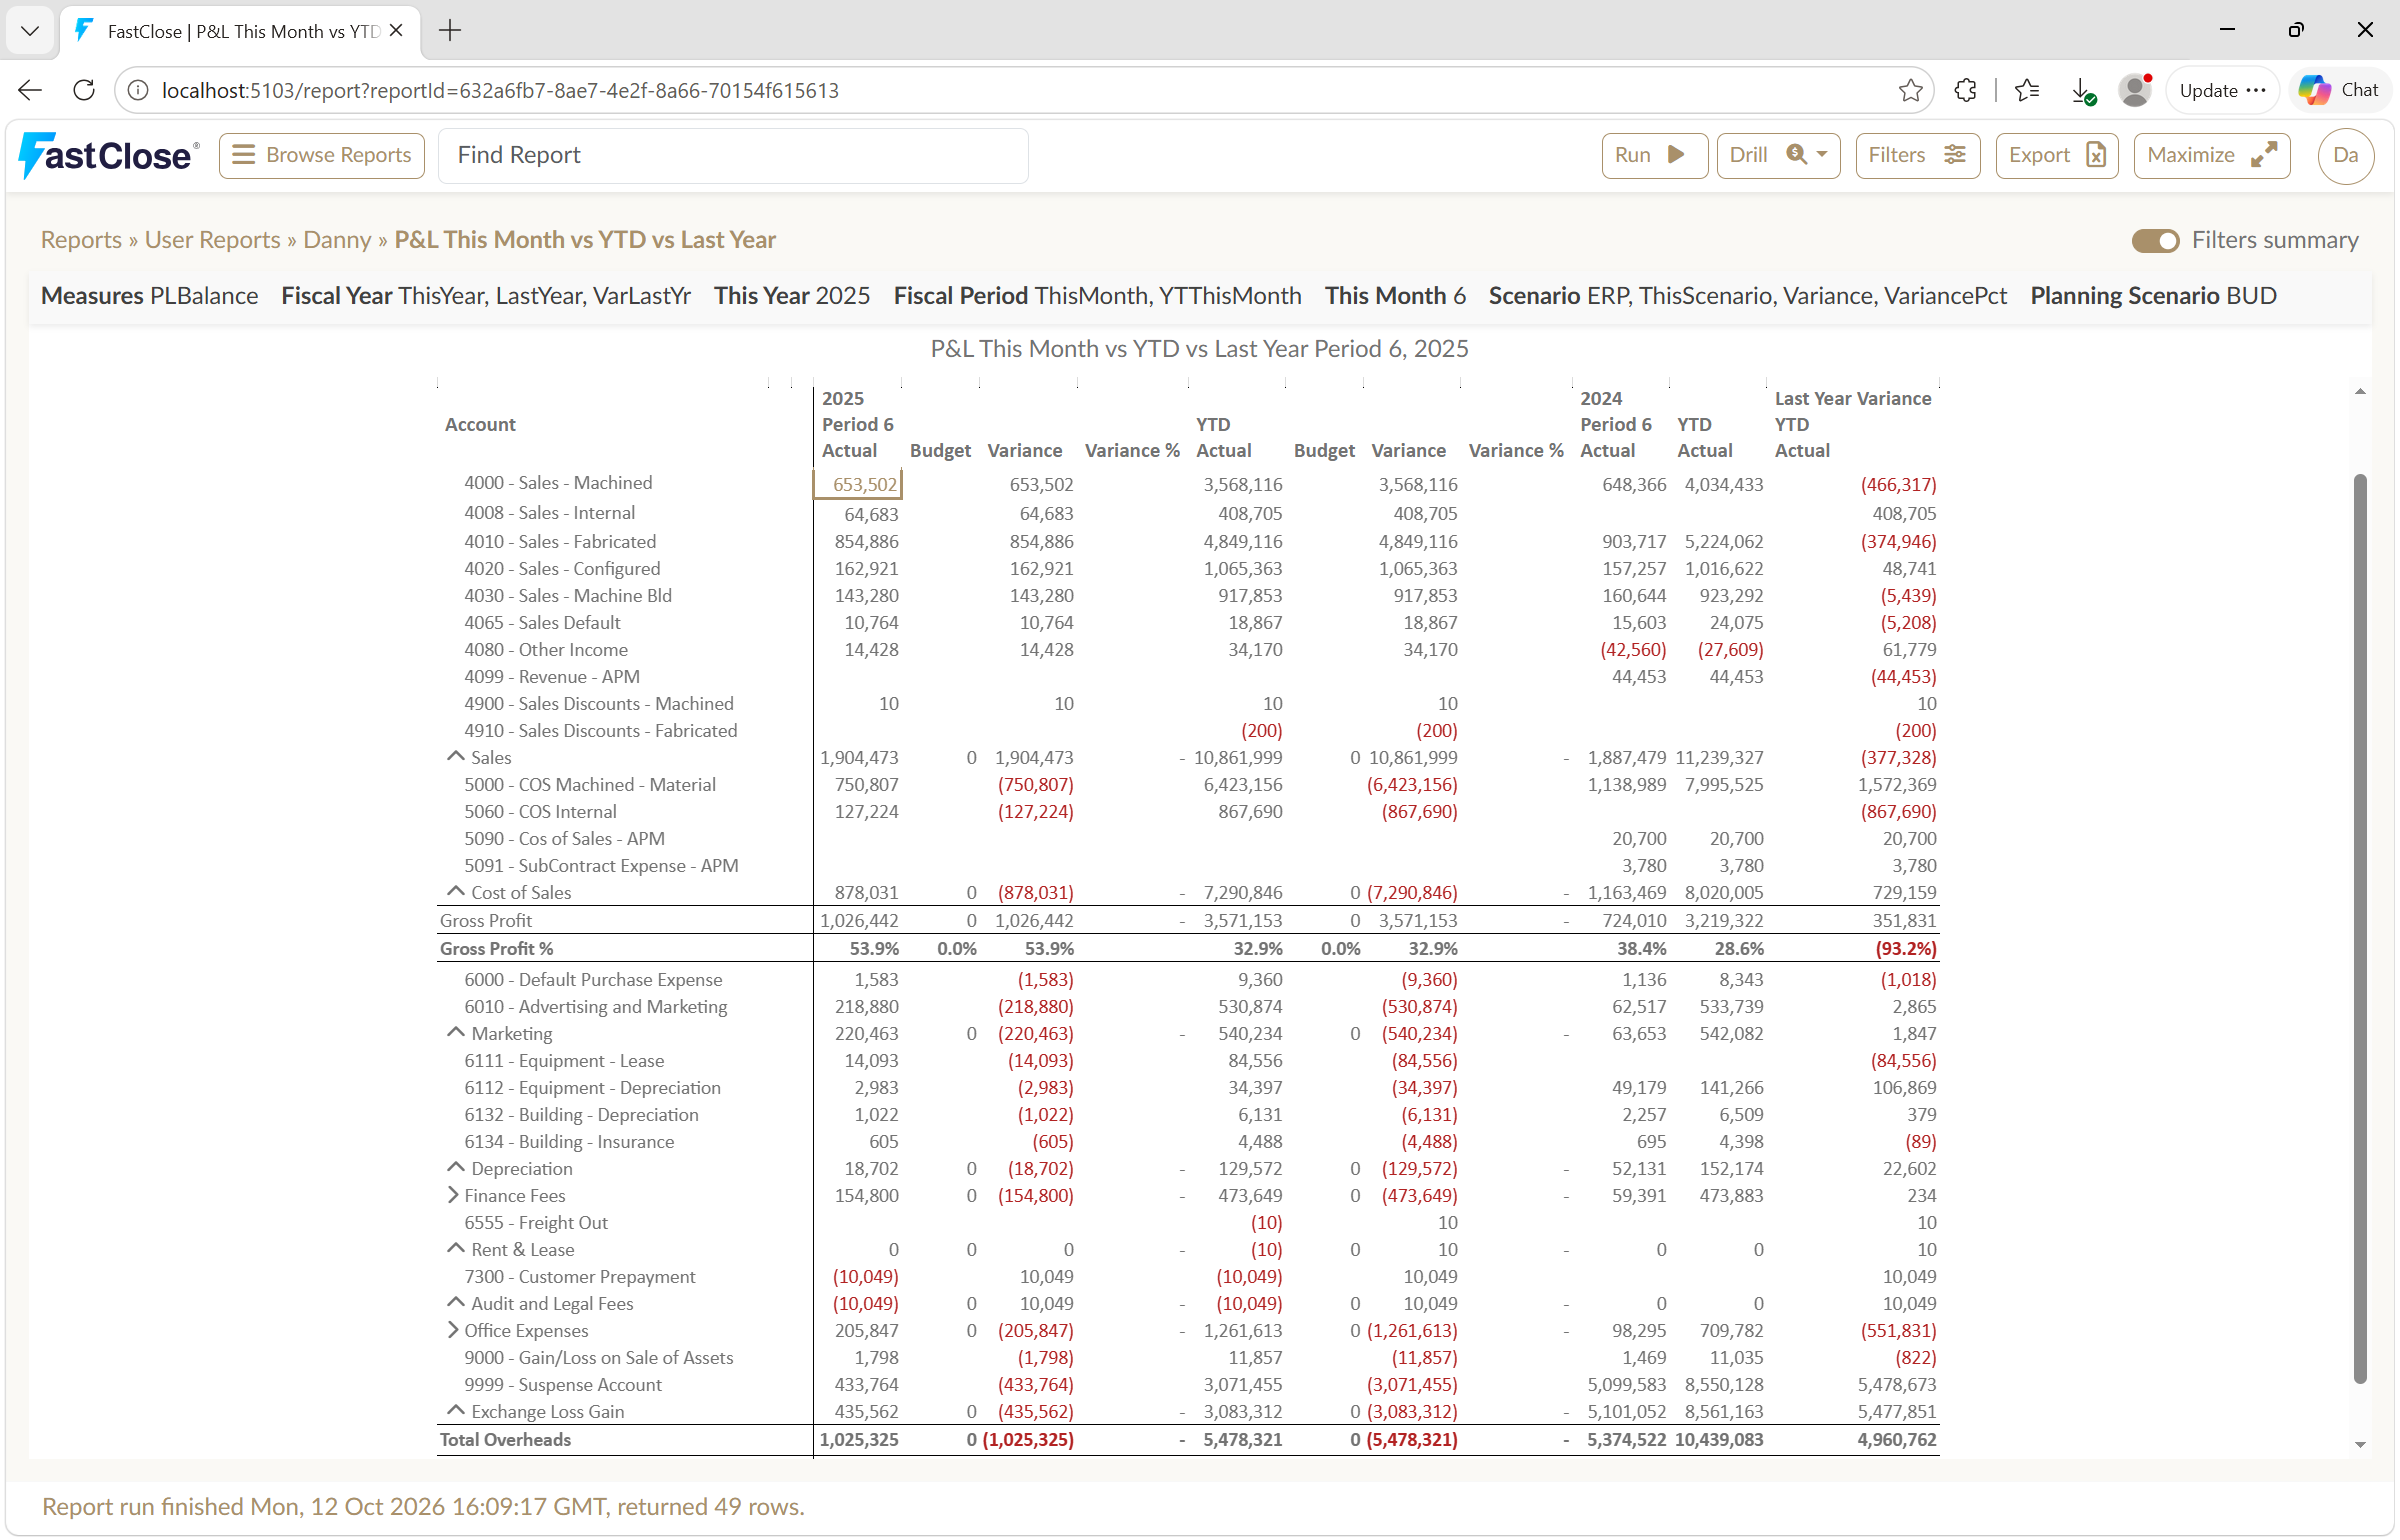
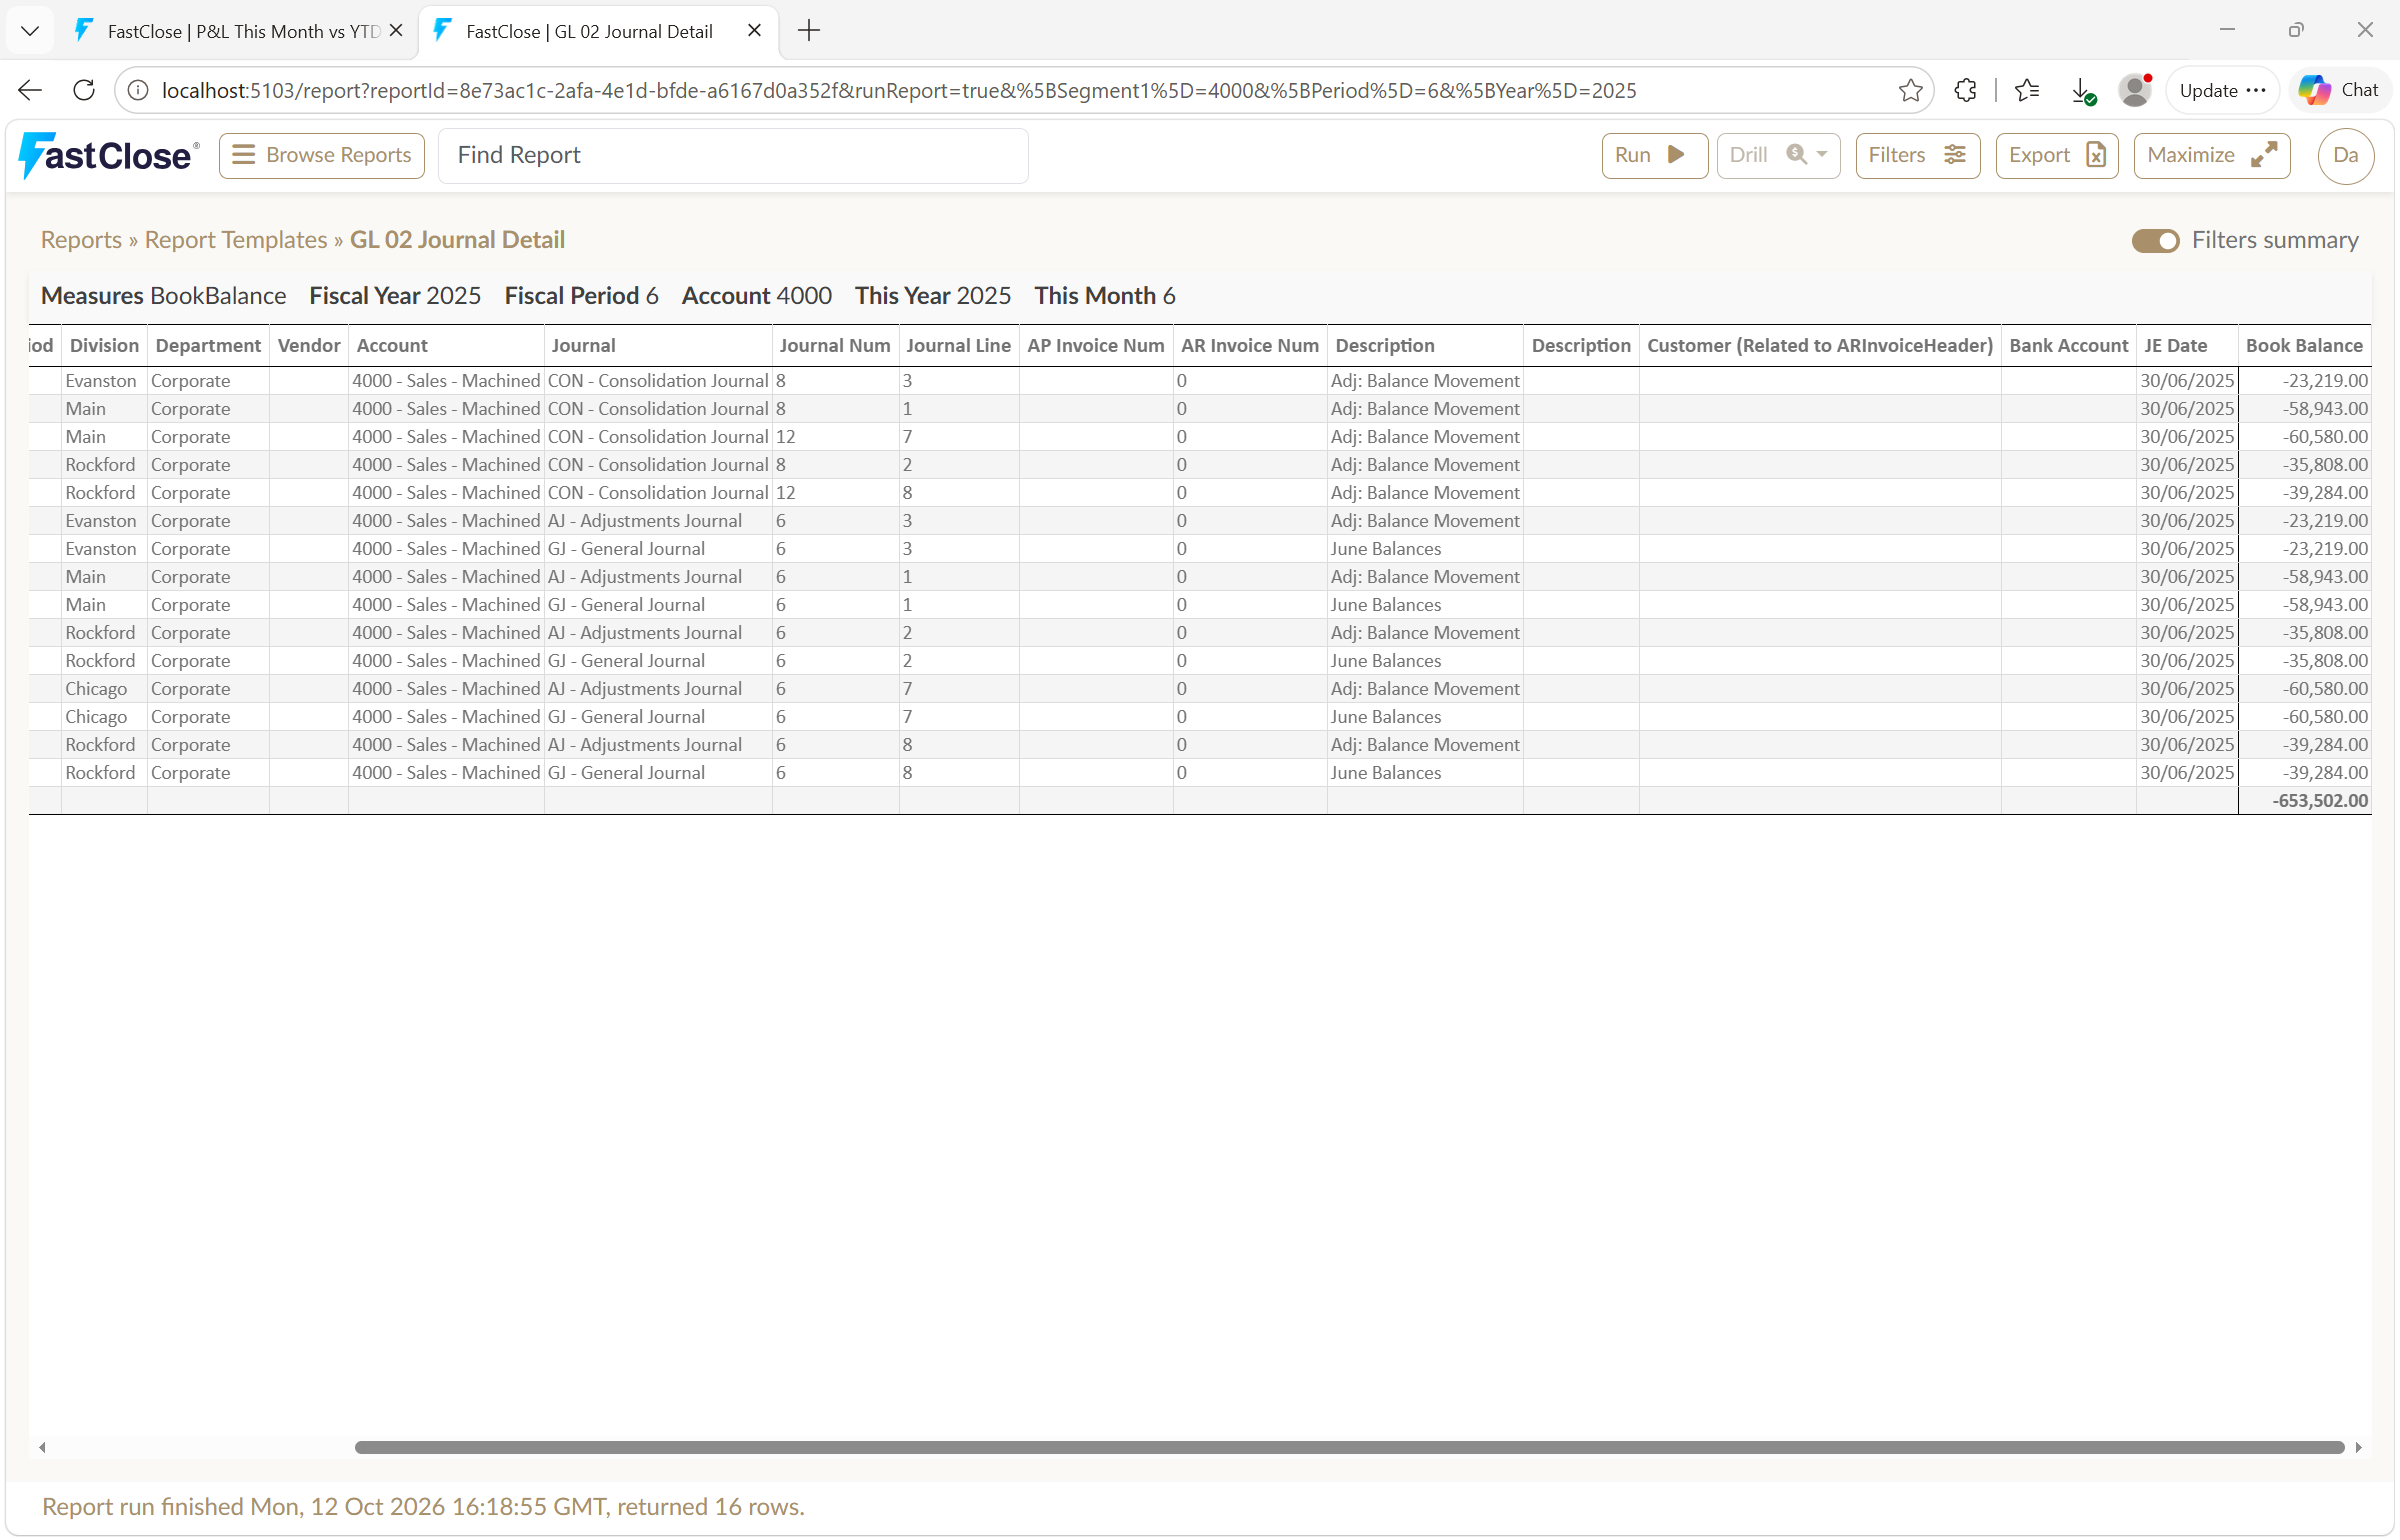
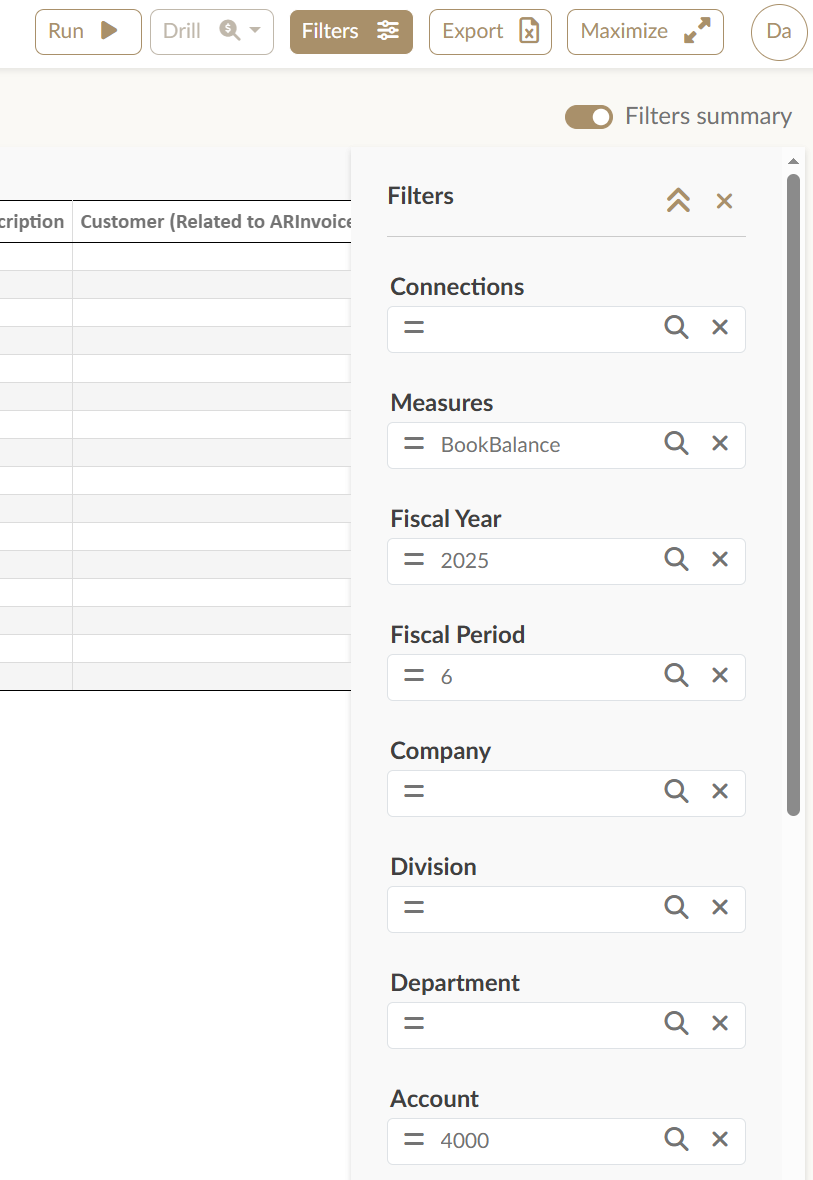
Where a KPI tile leads.
Read & Navigate isn't only a starting point — it's also the destination that FastCharts dashboards drill to. Click a FastChart or KPI tile and land on the underlying report in the Reader, already filtered to the right data.
Click through from FastCharts →
A dashboard tile isn't the end of an answer to a question — it opens the exact report behind it, here, ready to drill further.
Then to the transaction
From there, drill on again to the journal or invoice — the same chain a chart started, finished at the posting itself.
Fast on very large datasets
Scroll performance stays quick even on very large reports, so a detailed transaction listing is genuinely usable rather than technically possible.
?Common questions about Read & Navigate
Do readers need to install anything?
No. A manager opens a link and reads live numbers in the browser.
Can a reader break or change a report?
No. Readers run published report definitions and adjust only the filters the author exposed. FastClose reads from the ERP and never writes to it, so nothing they do can alter a posting.
How far does drill-down go?
To transaction detail — journals, invoices and the postings behind a figure — and sideways to related reports through drills defined in Designer.
Can readers export to Excel?
Yes. Any view can be exported for onward work — and users who want live reports in Excel rather than exports use the Excel Add-in instead.
How do we stop a site manager seeing group numbers?
Security is set on ERP dimensions — company, cost centre, account, warehouse — so a single published report shows each viewer only their permitted slice.
Is it quick on large reports?
Yes. Scroll performance holds up on very large datasets, which matters when the answer is somewhere in a long transaction listing.
Take the reader for a spin.
Ask us for a demo login and click around it yourself.