
Reporting, analytics, dashboards, consolidation and planning — directly in the hands of end users, running live off your ERP data.
Book a live demo
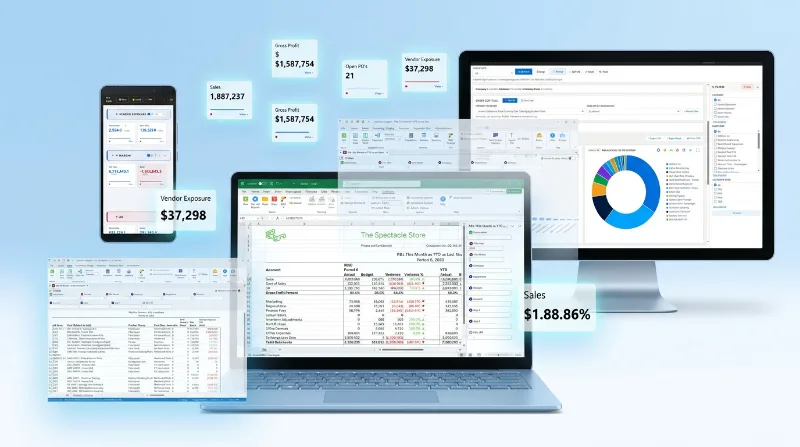
Drillable reports over live data turn into graphics and KPI dashboards — no visualisation tools to learn.
Build statutory consolidations using out-of-the-box solutions and get up and running fast.
Drill from high-level management views to the underlying transactions, via the GL to operational subledgers.
Also supports SAP Business One, SAP ByDesign, Business Central, Nextworld, Acumatica and Epicor Enterprise 7.
Installs in under an hour · Live against your ERP

Reporting, analytics, dashboards, consolidation and planning — directly in the hands of end users, running live off your ERP data.
Book a live demo
Drillable reports over live data turn into graphics and KPI dashboards — no visualisation tools to learn.
Build statutory consolidations using out-of-the-box solutions and get up and running fast.
Drill from high-level management views to the underlying transactions, via the GL to operational subledgers.
Also supports SAP Business One, SAP ByDesign, Business Central, Nextworld, Acumatica and Epicor Enterprise 7.
Installs in under an hour · Live against your ERP
Pick any part of the ring for a plain-English explanation.
{{ panelBody }}
FastCharts turns a report you already have into KPI tiles and charts — no separate BI model, no data warehouse to build first. Click any figure on the dashboard and it drills straight back to the report, and from there to the transaction behind it.
Purpose-built connectors for six ERPs. Epicor and SAP Business One are our primary platforms; Nextworld, Acumatica, Business Central and SAP Business ByDesign are fully supported on the financial core — and we build the rest out with you, free.


Power Users build content, everyone else uses it, in the best tool for their needs.
Build reports with drills and related-report navigation. Control and publish to end users. Lock data down by any ERP dimension.
Designer →Dashboards and KPIs generated from the FastClose reports you already have. No separate BI model, no Power BI project to wait for.
FastCharts →Run controlled reports live, change filters, combine in workbooks. Accurate numbers in the tool finance already lives in.
Excel Add-in →Managers and executives see numbers change in real time in the web. Drill to detail to catch problems early. No training required.
Read & Navigate →FastClose comes with a variety of content packs and enabling engines to report, analyse, drill, plan, reconcile, consolidate and visualise the business directly from live ERP information.
Virtual OLAP turns live relational ERP data into multidimensional analysis — no cube, no warehouse, no overnight batch.
FastClose Core →Budget holders model in Excel and submit against templates you define — then report the plan next to live actuals all month, no need to wait to month end.
FastPlan →Already built reporting in XL Connect or Epicor BAQs? FastConvert and FastBAQ bring that work across instead of starting from a blank page.
FastMigrate →Multi-company and multi-currency group reporting, including different translation treatments for P&L and Balance Sheet.
Most reporting tools stop at the general ledger. FastClose understands the whole structure of your ERP, so operations get the same live treatment the P&L does.
And if you find a piece of supply chain reporting you need that we don't have, and if it's a generic problem, we'll build it out with you — free.Operational reporting →
With FastClose Epicor reporting tools, we tackle reports we would never have considered possible with our previous toolset!
The FastClose SAP B1 reporting tool has paid for itself many times over.
A key part of this solution was FastClose for operational real-time reporting.
Installs in under an hour, value on day one.